Biotech traders have to adapt to any changes in the stock market, trying to adjust their trades and the game plan along with the markets condition. It is easier to take swing trades, long or short during a bull or bear market, but lately the choppiness and indecision hurt both longs and the shorts with no real direction in the short term; green days are followed by red days and so on. This is a technical analysis to help find some quick trades in stocks that have suffered from sell-offs along with the markets condition, with no negative news and no real change in the fundamentals. The best setup would be a consolidation pattern after a steep drop, with indicators in the over-sold territories preparing to bounce out or which has just turned up, showing positive momentum is building in.
I will try to find a few tickers every week for short term trades- stocks with near term catalysts and close to the breakout point, or ones already breaking out on large volume to join the positive momentum which can move the share price up sharply.
Adamas Pharmaceuticals, Inc. (ADMS)–Nasdaq
Adamas (ADMS) is a specialty pharmaceutical company working on modifying the pharmacokinetic (PK) profiles of approved drugs to create novel therapeutics for use alone and in fixed-dose combination products, trying to improve the lives of those affected by chronic disorders of the central nervous system (CNS). Focused on specifically Parkinson’s (PD) and Alzheimer’s Diseases (AD).
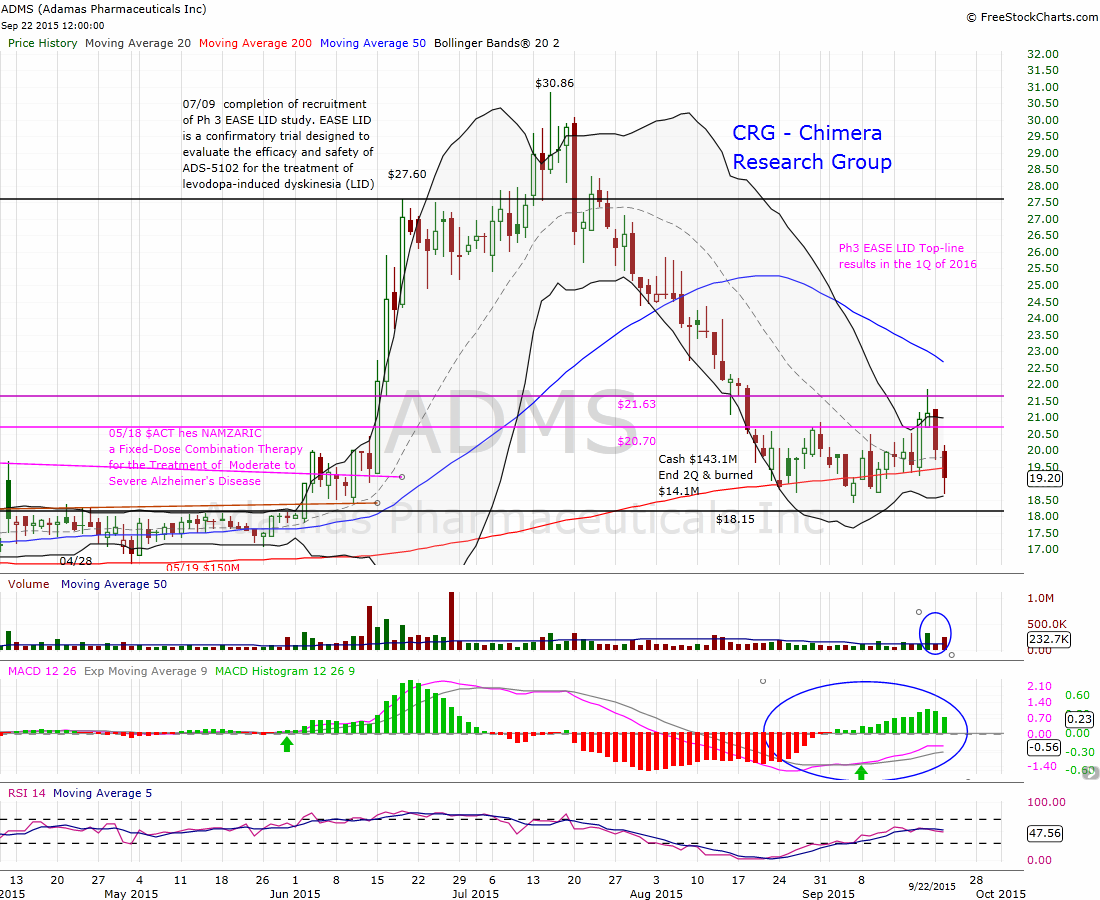
We had a long time follow up of ADMS, started with my technical analysis report “Adamas Pharmaceuticals – Volatility Squeeze Action” followed with a detailed report by Alfredo Fontanini “Adamas Pharmaceuticals: two interesting programs for Alzheimer and Parkinsons Diseases” ahead of the sharp move from the $18 area to reach a new 52-Weeks high at $30.86 just in 3 weeks after the breakout.
As the downtrend started in the XBI on 07/20, ADMS suffered from a sell off pressure as well, mostly by traders taking profits after the huge run to reduce risk, dropping hard from the high of $30.86 to reach the low of $18.40 and a very close to the support line $18.15.

After two weeks of a side-way trading and price consolidation between the $18.40 point to the $20.70 weekly resistance line, we can see a clear breakout of the resistance line on average volume, followed by continuation candle on X3 the volume average to confirm the breakout. But Hellary’s tweet about the drug pricing brought a sharp sell off all over the biotech sector, including ADMS that dropped down towards the lower Bollinger band, creating a new buying opportunity . The indicators shows a positive momentum, that can lead to a strong follow up to breakout the second resistance line at $20.40 and $21.63 again, in case more momentum traders joining the move along with the fundamentals traders who are buying or holding a position, as we get closer to the important catalyst of complete enrollment in the 13-week Phase 3 study of ADS-5102 in LID by year-end, and report the top-line data for Phase 3 EASE LID study in the 1Q-2016.
My first target will be the 50-Day moving average around $22.67 followed by the $27.60 resistance line at least, as we are getting closer to the catalyst. On the other hand it is an easy trade with high reward vs. low risk because we can put a tight stop loss, a few points below the last low of $18.40 or a few points below the $18.15 support linefor traders who are willing to work with a wider risk management.
BioDelivery Sciences International, Inc. (BDSI) –Nasdaq
BioDelivery Sciences (BDSI) is a specialty pharmaceutical company with a focus in the areas of pain management and addiction medicine. BDSI utilizing its novel and proprietary BioErodible MucoAdhesive [BEMA] and other drug delivery technologies to develop and commercialize in house or in partnership with third parties. BDSI have two approved products, “ONSOLIS” for the management of breakthrough pain in cancer patients, and “BUNAVAIL” for Opioid dependence.
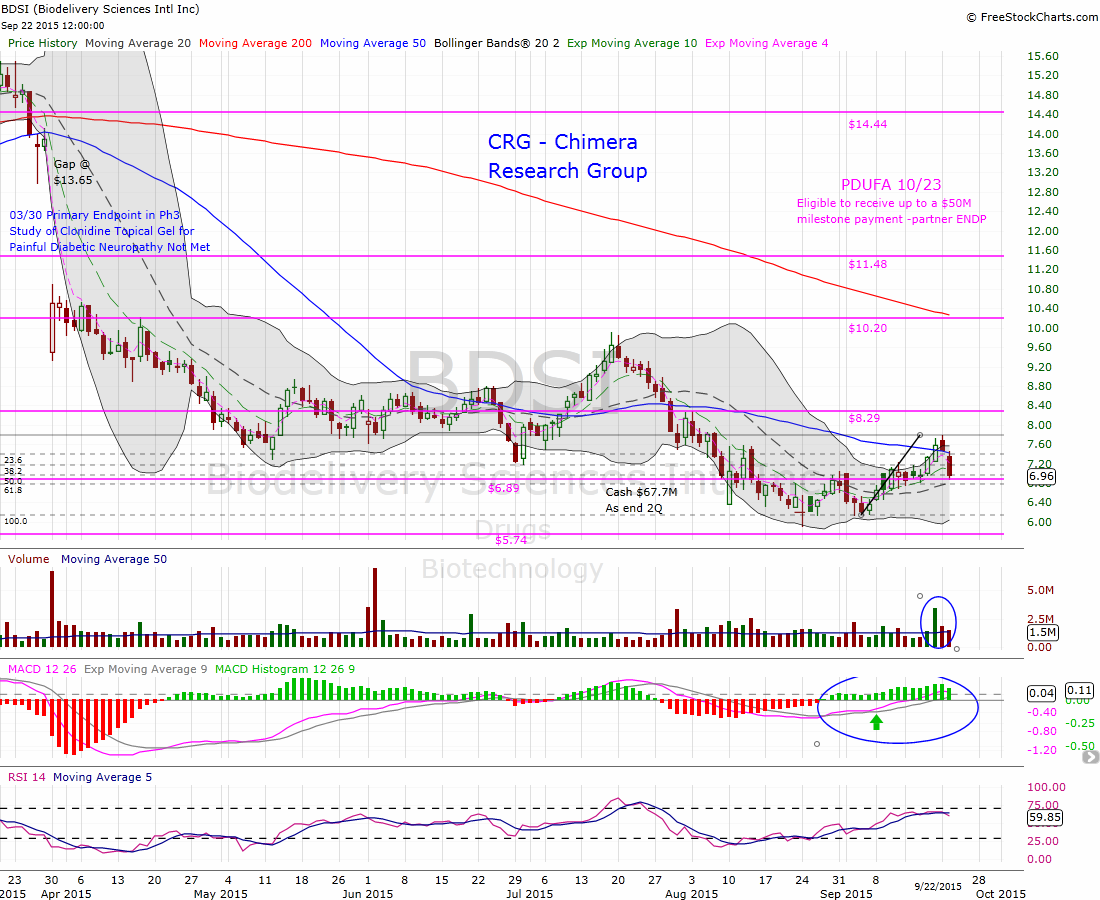
BDSI is seeking FDA approval for BELBUCA, the company’s treatment for moderate to severe chronic pain, a collaboration with Endo International plc (ENDP) as a partner. BDSI and ENDP are waiting for the FDA approval, with PDUFA date set on October 23, 2015, an approval of BELBUCA would trigger a $50 million as a milestone payment from Endo. Moreover, a royalty in mid- to high-teens from future sales.
Traders like a fixed date catalyst like the PDUFA date, where you know the exact date of the binary event, and you can plan your trading well ahead of time, to define the entry and exit points or hedging ahead of time for a risk management.

The same as ADMS, along with the markets correction BDSI suffered from a sell off pressure as well, dropping hard from the high of $9.91 to reach the low of $5.89 within 26 trading days, then start trading side-way giving us the hint that it might reached the bottom at this point, where investors are willing to buy any shares offered at this point. We can see the Bollinger Bands getting closer to each other and forming a horizontal channel, where the $6.89 line used as a resistance line few times, and with the strength in biotech sector by the end of last week, the momentum traders pushed the price upward causing a breakout of the 50-Day Moving Average at a significant large volume almost X3 the daily average volume, and closing above the 50MA as well. But Hellary’s tweet about the drug pricing brought a sharp sell off all over the biotech sector, including BDSI that dropped down towards the $6.89 support line and the Fibobonacci 50% retracement line, creating a new buying opportunity.
As a trader, I want to see a maximum correction reaching the Fibonacci 61.8% around $6.77 but closing above the $6.89 support line, followed with a continuation green upward candlestick to confirm the reversal the new uptrend. I will be looking to hold till the PDUFA date on 10/23. My first target will be the $8.29 weekly resistance line, followed by the $10.20 while there is a chance to see closing of the open gap at $13.65 in the day of FDA approval. On the flip coin, if we get a continuation of the sector selloff, I will put a stop loss a few points below the last low of $6.15.
Disclosure: Author is long BDSI and ADMS
For a followup charts and comments, please follow me at twitter @gantosj


thanks Joe
ADMS:
Institutional Ownership 80.62%
http://www.nasdaq.com/symbol/adms/institutional-holdings
But Yahoo says: 11.5%
http://finance.yahoo.com/q/ks?s=ADMS+Key+Statistics
Which is it?
I’ll em company.