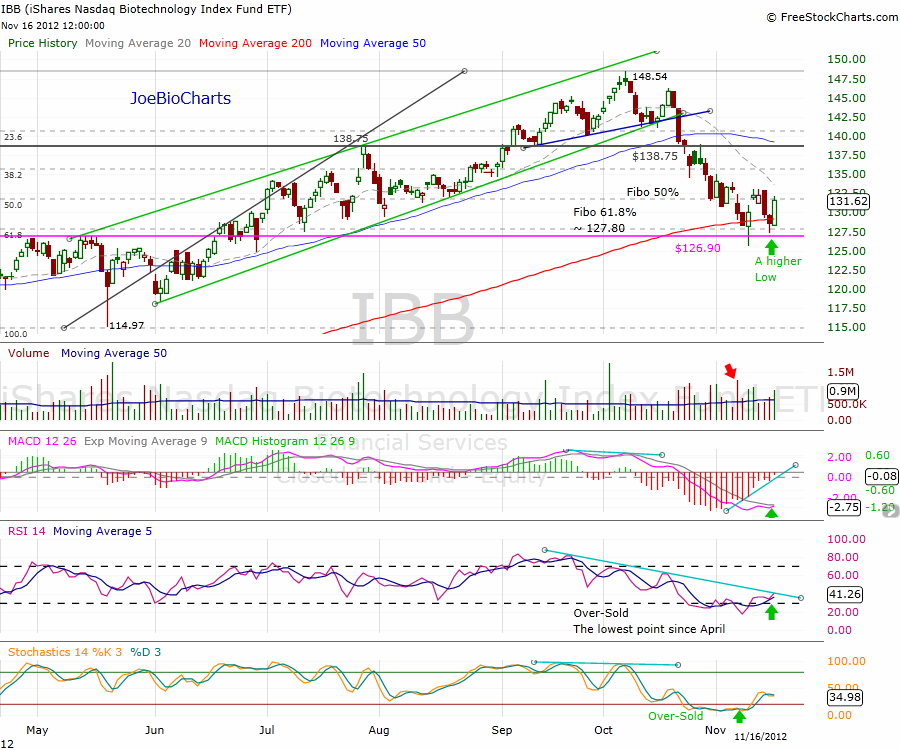
In my previous report “IBB – Nasdaq Biotechnology Index – Reaching a Critical Point ” I tried to find out if the technical correction in the index $IBB reached a support area, and the price found a support line around the Fibonacci 61.8 or the weekly support line at 126.90 points.
Today the price reached the 200MA and is very close to the full technical correction. The Fibonacci 61.8 line around 127.80 points, followed by the weekly support line at 126.90 points as well. Usually the 200MA is a strong support line, as it is hard to change the major-trend so fast. It takes weeks or months to change it and start a new major downtrend.
Let us take another look at the daily chart, as the price dropped below the 200MA. However, the price found support at the 126.90 weekly support line (pink line on the chart), although the price dipped a little below the line, but recovered immediately and closed above it. In the next day the price gaped up, but the overall negative sentiment in the markets caused a price retreat; which closed the gap and rechecked the support line for the second time resulting in a bullish signal and hope of change (a higher low).

Looking at the indicators, we can see that all the indicators visited the oversold territory, while the RSI and Stochastics have reached the lowest point since April 2012. Currently, we see the first sign of recovery as the RSI and the Stochastics crossed up the oversold line, while the MACD is very close to cross the signal line as well.
Let’s watch the price action closely, we have to see a “higher high” first, in order to get a direction change confirmation. However, a side-way action will be a good sign as well.
Along with the Biotechnology Index, we have to look at the markets and the leading index is the $SPX (SP-500). Traders and investors should keep an eye on the headlines about the Fiscal Cliff in the US, as we get closer to the simultaneous end of president George W Bush era, tax breaks and automatic spending cuts from January 01st 2013. To get a clue of how the news can affect the price action, take a look at the Friday’s bounce, that happened just after the Fiscal Cliff talks at the White House. Where Mitch McConnell noted it was “a constructive meeting.

In the $SPX daily chart, the price break down the 200MA last week, had a pause and created a bear flag, then the price continue falling to reach the Fibonacci 61.8 retracement line, a full technical correction of the last uptrend.
If we look back at the chart, it’s easy to find a similar behavior in the price action (2 highlighted circles) after reaching the high of 1415.32 points in 5/1/2012. The markets had a deep technical correction reaching the 1266.74 points in 6/4/2012, and bouncing back from that point, running all the way up within uptrend channel reaching the high of 1474.51 a new 52 weeks high.
If we look at the indicators, we can again find a similarity, as all the indicators already in the oversold area, while the RSI just had a cross above the oversold area & heading upward.
Is it the bottom ?
The markets reached an extreme oversold levels, presently only 24 companies from the biotechnology index with a share price over the 50 and 200 day moving average !! that’s a sign of extreme oversold, and historically this is the levels and right time when the markets starts looking for a change.
It is hard to tell right now if the markets have reached the bottom and will turn around creating a V shape as it had six moths ago, the signs all over the chart give a hint of change. Yet, we need more green and strong days, a positive momentum in the indicators, and nothing but some positive news about the Fiscal Cliff solution getting closer- in which case, we can get a new strong uptrend.


