ACADIA Pharmaceuticals Inc. (ACAD) -NasdaqGM
Catalyst: late Nov. P-III results for Parkinson disease
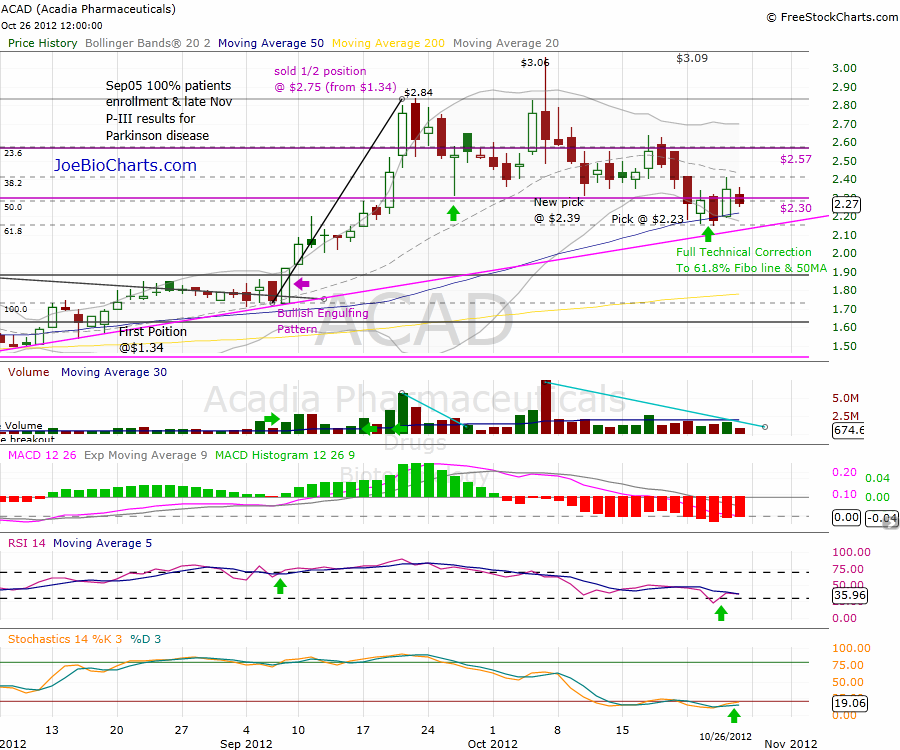
Acadia reported a 100% patient enrollment on Sep 05th: ACADIA Pharmaceuticals Announces Completion of Enrollment in Phase III Pimavanserin Trial in Parkinson’s Disease Psychosis Top-Line Data Expected in November 2012, as I mentioned earlier in my last report and since 09/07 the price started a real uptrend, spiking from the low of $1.73 & reaching the high of $2.84 just in 11 trading days.
Daily Chart

The price had a full technical correction, reaching the Fibonacci 61.8% line, which is used as a support line along with the 50MA. While below both of these lines, there is another support line (the pink uptrend line) starting from Aug. 10th through Sep. 7th. This line should be a strong support line in case the price breaks down below the Fibo-61.8 & the 50MA.
As we get closer to the catalyst date $ACAD will return to the spotlight & even more “catalyst traders” will start positions looking for the last run-up ahead of the data release. This new demand should give the price a boost to bounce back from mentioned support lines & run-up again potentially reaching a new high. There are, however, several resistance points that need to be penetrated.
Both indicators, the RSI & the Stochastics are in the Over-Sold area. The RSI has already changed direction and started heading upward reaching the value 35.96 on Friday. First, we need to see a breakout of the $2.30 resistance line with increasing volume & the shares need to close above it, that will trigger the price to test the next resistance line @ $2.57 (see the chart).
If the pressure & the downtrend in the markets stop, the price can move higher to retest the last 52 week high @ $3.05 ahead of the results.
The Trade
If you already have a position then keep watching those support lines to manage your risk. For new trades, a good entry point is right now using a very tight stop loss, just under the uptrend line at around $2.10. This will ensure a trade with lower risk, as we are risking around 5.5% assuming we can exit at our set stop loss target. On an upside basis the shares could run-up to around $3.05, which is a potential uptrend of around 35% – thus entering the trade now offers decent risk/reward.
Disclosure: Author is Long ACAD


After the earnings cc & the CEO confirming that the results will be released till the end of November the price get a boost gaping up & breaking out the $2.57 resistance line.
$ACAD used the ATM to raise $7M in the 3rd quarter.
$ACAD CEO: while we are finalizing the -020 study we are also busy with preparations for the second planned pivotal trial in our PDP program, which we call the -021 study.
If the price close above the resistance line $2.57, then the next target will be the $3.19 ahead of the results.
In the other hand, manage your risk, as the price will get hammered and drop hard in case of a negative results.
What are you basing your $3.19 target on?
Colin,
Read my comment again ” If the price close above the resistance line $2.57 “
but the price didn’t close above $2.57 as a sell-off hit ACAD & closing @ $2.42, then the price kept under pressure along with the overall market.
The $3.09 target that I mentioned is the next resistance line & in a good market condition we could see a strong run ahead of the data
I worded the question incorrectly – what I was really asking about was whether or not your target (be it $3.09 or $3.19) was based purely on technicals. You’ve addressed that. I was more curious about a price target for ACAD based on fundamentals (e.g., if the Phase III data for Pimavanserin is positive). It has huge market potential, some suggesting that it might drive up ACAD’s sales to north of $1billion.